First, set up the form. Name the problem of interest and list it on the sheet and list the expected defects or causes that contribute to the problem and list them in the first column. Decide on the person to be the data recorder, and the period of time the data will be captured.
The tracking should be done to reduce the chance of double counting, so it is preferable to assign one person to be the data recorder, as appropriate.
Second, during the time set for tracking, the data recorder will place a checkmark under the Count column each time a defect/cause is observed. If over time, the same cause is repeated, there will be several checkmarks in that cell.
Third, when the time period is over, then count the total number of checkmarks in each cell and write the number into the column marked Number of Checkmarks. At the bottom of that column, fill in the Total Defects. You can now calculate the percentage of checkmarks there are for each defect.
This may be enough information for the group to stop and review the information to decide on which defect they want to prioritize.
Use this data to produce Pareto Chart to discover common reasons for problem and focus on improvement opportunities.
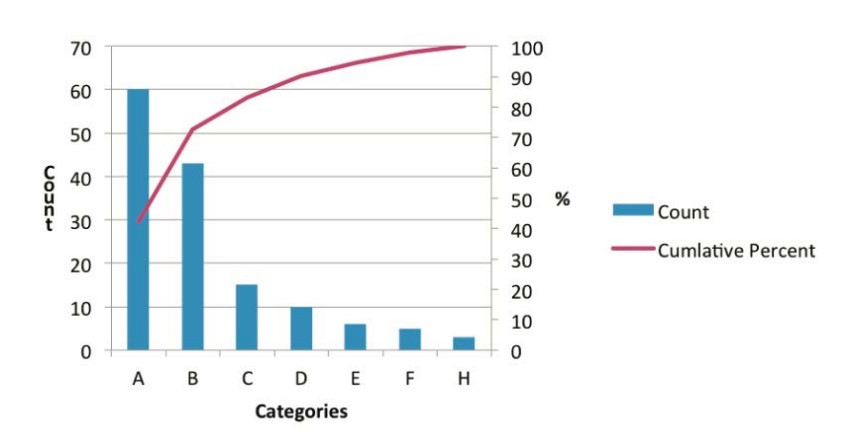
Some groups will take this a step further and place Defect Check sheet results into a chart format, as seen in the Pareto Diagram below. To do this, name the defects along the bottom of the graph in the order of highest frequency to the left, and lowest frequency to the right. Show the frequency using a bar chart.
Create a line indicating the cumulative percentage of contribution (excel and . A classic Pareto effect will reveal that 20% of defects causes actually make up 80% of the problem; In the case of the graph below, of the 8 reasons that diagnostics were not done, the first two reasons listed account for just under 80% of the occurrences of this problem.
There are software programs that generate this graph, or it can be done using graph paper.
Learn@AMA Training
Enrol in our new ACTT curriculum today to learn core competencies of a Practice Facilitator. The training is offered as Comprehensive or Self-Directed.
Enrol Today!Additional Resources
Quality Improvement Resources Practice Facilitation ResourcesDeveloped by