Run charts show team performance and if there is a real trend towards improvement, or if it's a variation in the system.
To create a run chart:
- plot equal time periods on the horizontal axis.
- plot the values of what is being measured on the vertical axis.
- show the values collected at each regular period of time and connect these points with a line.
2 Rules to Identify Improvements with Run Charts:
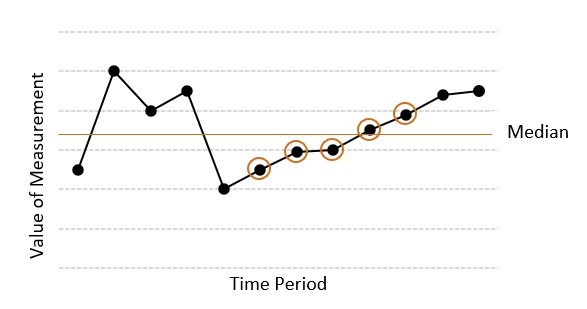
RULE 1: 5 consecutive points increasing or decreasing
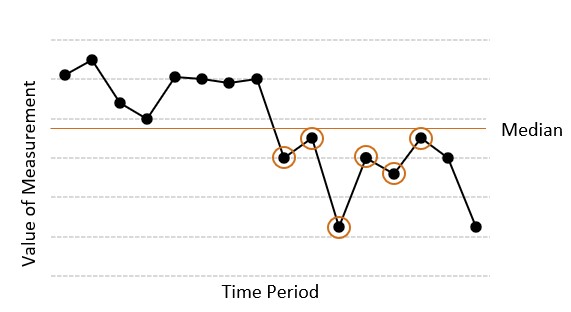
RULE 2: 6 consecutive points on either side of the median.
The median is the line on the graph with an equal number of data points above it and below it.
Learn@AMA Training
Enrol in our new ACTT curriculum today to learn core competencies of a Practice Facilitator. The training is offered as Comprehensive or Self-Directed.
Enrol Today!Additional Resources
Quality Improvement Resources Practice Facilitation ResourcesDeveloped by